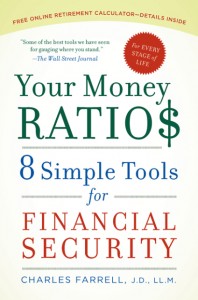
But there’s an easier way to plan that allows you to focus on some very clear and simple goals. Professional investors have for years been using financial ratios as shortcuts to evaluating the financial health of large companies. By looking at a few key ratios, investors can get a quick and comprehensive assessment of what sort of shape a company is in. The beauty of the ratios is that they compress mountains of data into one simple number that conveys a great deal of information.
Well, you too can use ratios for managing your own finances. Now, there are differences between individuals and companies. For one, individuals have a goal of retiring some day, and companies in essence have perpetual existence. So the financial ratios that a company might have in 2010 could be just fine in 2050.
But individuals need to progress down a clear path that starts when they enter the workforce in their 20s (with a job and no assets) to when they leave the workforce in their mid 60s (with lots of assets and no job). So how do you live your financial life each year with that transition in mind? That’s why I developed the ratios; to help you make that transition over your working career. The ratios start at age 25 and lead you down the path to a secure retirement at 65, while showing you where you need to be each year along the way.
Ratios are actually used in all walks of life to simplify complex decisions and data. For instance, if you follow sports, ratios are everywhere. Take baseball for example. You could get a spreadsheet of every at-bat a player had for the season and what happened, or just look at his batting average, which is a ratio of hits to at-bats. If you like to bake, a recipe that calls for 2 cups of flour to 1 cup of milk is a ratio of 2:1. Or if you’re into fixing cars, transmissions have gear ratios.
For the field of personal finance, I have developed a set of 8 unique ratios that individuals can use to determine how much they should be saving each year, how much they should have saved at their age, how much debt they can incur, how to invest their retirement assets, and how to buy the insurance necessary to protect their income and assets.
The goal of the ratios is to get you to a point where you can retire in your mid 60s on about 80% of what you were earning prior to retirement. But to get there, you need to be hitting specific benchmarks along the way from ages 25 to 65. The ratios serve as a road map to help keep you on track.
Here’s an example. One of the ratios I developed is call your “Capital to Income Ratio.” It tells you how much investment capital (retirement savings) you should have at your age if you want to be on track to retire at 65. It’s incredibly easy to use. You just take your household income and multiply it by the ratio, and there’s your answer. So if you make $100,000 and your Capital to Income Ratio for your age is 3, it tells you that you should have $300,000 saved for retirement. If you have more than that, great. If you have less, then you can quickly determine what the gap is.
By using ratios, you’re imposing a certain amount of simple discipline that will help drive you toward your long term financial goals each year. And the clearer the goals are, the easier it is to get your financial life organized around them. That’s why ratios are so powerful. They’re simple and clear.
Copyright Charles J. Farrell. All rights reserved.
I like the idea of creating a roadmap. So often, when we are younger, we neglect to think of the future, assuming we have plenty of time. However, it is a good idea to plan ahead, and you’re never too young to start.
.-= Miranda´s last blog ..Reader Question: How Much Life Insurance Do I Need? =-.
A road map is something I need to be more proactive with. I spent a lot of time thinking I had plenty of time…